Monitoring
Appliance resources can be monitored at a system-wide level. Exhaustion of any of the resources can have a negative impact on the speed of the transcription.
The following resources can be monitored:
Here is an example GET request for the mem (RAM) resource:
curl -sSL -u admin:admin -X 'GET' \
    "http://${APPLIANCE_HOST}/v2/management/meminfo" \
    | jq
Here is an example response:
{
  "available_kb": 23412128,
  "total_kb": 32862660,
  "usage_percentage": 14.907302,
  "used_kb": 4898936
}
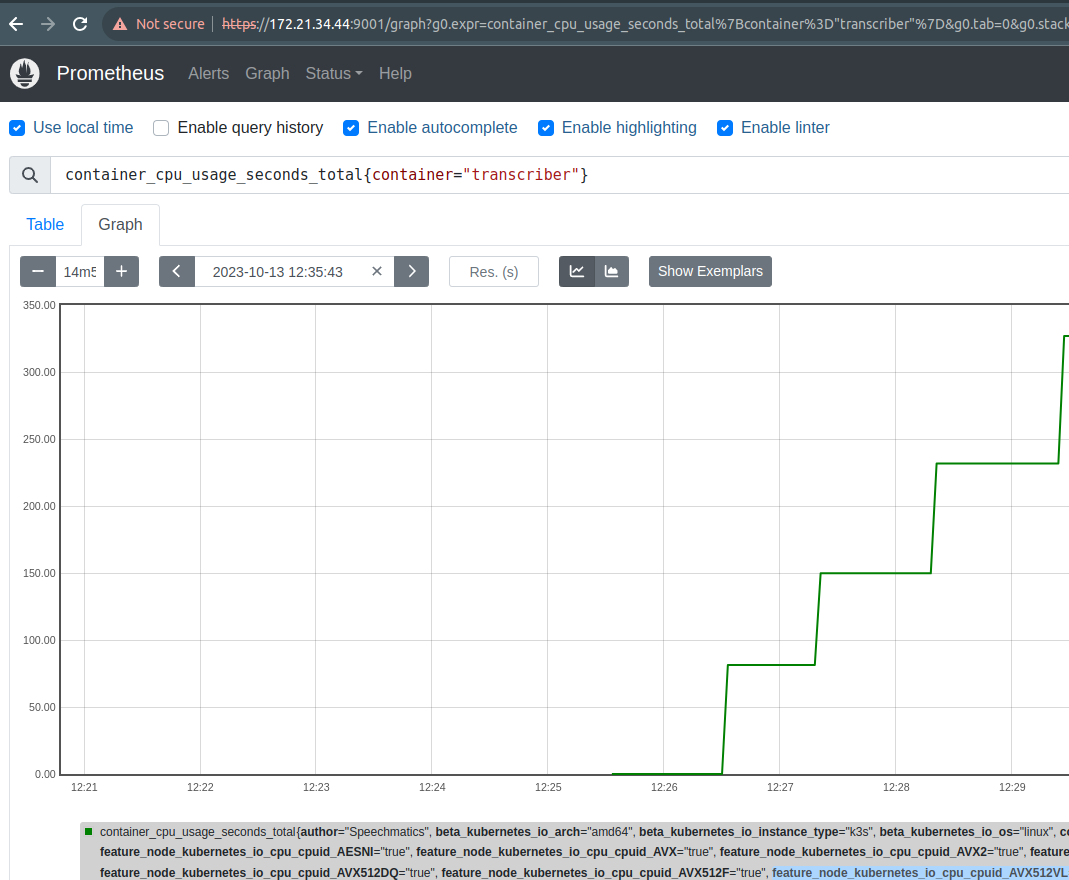
Prometheus metrics
For advanced monitoring, Prometheus is available on port 9001 in a browser. The default credentials are the same as for the Management API, admin:admin unless changed by the user.
https://${APPLIANCE_HOST}:9001/graph
The Prometheus endpoint for clients like Grafana is https://${APPLIANCE_HOST}:9001/
Useful Prometheus queries
Disk space left on the transcription jobs partition
# Other useful values are / for the root partition, and /opt/speechmatics/monitoring for the logs partition
node_filesystem_free_bytes{mountpoint=~"/opt/speechmatics/jobs"}
Memory used by individual container images
# Autocomplete will offer container names
container_memory_rss{image=~"docker-master.artifacts.speechmatics.io/k8s/batch-jobs-api-v2.*"}
Memory used by the host in total
node_memory_MemFree_bytes
Amount of successfully POSTed data over HTTPS
traefik_entrypoint_requests_bytes_total{code="201", method="POST", entrypoint="websecure"}
Collecting logs
Logs can be downloaded in a zip file from the Management API via the logs/zip endpoint:
curl -sSL -u admin:admin -X 'GET' \
  "http://${APPLIANCE_HOST}/v2/management/logs/zip?limit=1h" \
  -H 'accept: application/zip'
A time limit can be set via the ?limit=X query parameter, for example: 8h5m3s, 8h, 3h30m, 300s. The default unit is seconds if none is supplied, and if the limit is omitted the last hour of logs are returned. Note that the time limit applies to the contents of the logs, as well as which logs are returned, so logs which started before the cut-off point will be truncated and only the tail of the log will be returned in the file.
The zip file will contain logs for all currently running Kubernetes deployments, and in a directory called extra, logs collected by the Grafana Loki subsystem, which will include transcription job logs, and logs for Kubernetes pods which have completed.
Requesting too large a time interval may timeout the request, in which case you may need to log onto the box and use kubectl commands directly, or use one of the techniques in the next section.
Advanced log collection
In addition to the logs endpoint in the Management API, which downloads a zip file of recent logs, more fine grained access to logs is available using logcli, the command-line client for Loki log aggregation (part of the Grafana ecosystem)
For installation instructions for logcli please see loki documentation
The Appliance exposes the Loki logs endpoint on port 3100, using an org-id of "fake", which is the Loki standard for a single-tenant installation. As with Prometheus, the default credentials are admin:admin unless changed by the user.
Query logs for a particular Kubernetes deployment
export LOKI_ADDR=https://${APPLIANCE_HOST}:3100/
./logcli \
  -o raw \
  --username admin \
  --password admin \
  --tls-skip-verify \
  --org-id=fake query '{instance=~".+:k8sbuffer"}'
We use the -o raw switch because logs are already in JSON format.
Query limits
Query results are limited to 1000 entries by default, and series and labels commands return results within the default period (1 hour). To extend the default period, use the --from switch (as shown in an example below).
Getting the logs for a specific job
For a job with id 1o9islfv29, first find which series this corresponds to:
export LOKI_ADDR=https://${APPLIANCE_HOST}:3100/
./logcli \
  -o jsonl \
  --username admin \
  --password admin \
  --tls-skip-verify \
  --org-id=fake series \
  --from="2023-12-13T10:00:00Z" '{}' | grep 1o9islfv29

{instance="default/job-1o9islfv29-h8cw7:blobuploader", job="loki.source.kubernetes.pods"}
{instance="default/job-1o9islfv29-h8cw7:transcriber", job="loki.source.kubernetes.pods"}
{instance="default/job-1o9islfv29-h8cw7:preprocessor", job="loki.source.kubernetes.pods"}
Three series are listed because a transcription job (corresponding to a Kubernetes job) has three containers in its Kubernetes pod. You can request one at once (usually the transcriber log is most useful), or all three by using a * wildcard, like this: '{instance=~"default/job-1o9islfv29-h8cw7:.*"}'. Note that using a wildcard will merge the logs.
export LOKI_ADDR=https://${APPLIANCE_HOST}:3100/
./logcli \
  -o raw \
  --username admin \
  --password admin \
  --tls-skip-verify \
  --org-id=fake query --from="2023-12-13T10:00:00Z" '{instance="default/job-1o9islfv29-h8cw7:transcriber"}'

{"jobid": "1o9islfv29", "Request-ID": "477c5bc3ad4027d973b59f2f9ec4276e", "msg": "Shutdown complete", "level": "INFO", "time": "2024-01-05T11:33:19.733285"}
{"msg": "Eats client process finished", "level": "INFO", "time": "2024-01-05T11:33:19.717805"}
{"msg": "Transcribed 4 seconds of speech", "level": "INFO", "time": "2024-01-05T11:33:19.503377"}
{"jobid": "1o9islfv29", "Request-ID": "477c5bc3ad4027d973b59f2f9ec4276e", "msg": "RTF: 3.291123", "level": "INFO", "time": "2024-01-05T11:33:19.502920"}
...
The transcriber log can also be requested more simply via the jobs API itself.
If you have issues with HTTP notifications being sent, examine the log of the blobuploader which is the final stage of the transcription process. If there are problems with audio format or pulling audio from a remote source, examine the preprocessor logs.
Useful Loki queries
Batch
Job RTF (Real Time Factor)
Provides a measure of job processing time relative to the length of the audio file, useful for measuring/optimising throughput.
'{job="loki.source.kubernetes.pods", instance!="monitoring/loki-0:loki"} |= `COMPLETED_JOB` | unpack | __error__=``'
Returns a list of json log lines containing the field rtf where each line represents a single completed job.
Realtime
Final Lag
Provides a measure of lag between audio sent and audio transcribed, useful for measuring/optimising throughput.
'{job="loki.source.kubernetes.pods", instance=~"default/sm-proxy-a.*"} |= `connection usage stats` | unpack'
Returns a list of json log lines containing the field g.final_lag where each line represents the final lag for a minutes usage of a given session.
Partial Lag
Provides a measure of lag between audio sent and partial transcriptions, useful for measuring/optimising throughput.
'{job="loki.source.kubernetes.pods", instance=~"default/sm-proxy-a.*"} |= `connection usage stats` | unpack'
Returns a list of json log lines containing the field g.partial_lag where each line represents the partial lag for a minutes usage of a given session.